
|
|
|

Of Counsel: Winton C. Smith, Jr., JD Professional Partnerships: Hospice Philanthropy Group L.L.C.
|
Quote for today: I expect to pass through life but once. If therefore, there be any kindness I can show, or any good thing I can do to any fellow being, let me do it now, and not defer or neglect it, as I shall not pass this way again. ~William Penn _____________________________________________________________ Past issues of Newsletter are available in the Newsletter Archives _____________________________________________________________ |
|
|---|---|---|
|
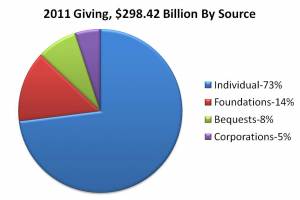
Bequests Rule...Income up 8.8%..... Giving USA estimates for 2011 indicate while overall giving slowed, gifts from living individuals increased 3.9%, while bequest giving increased 12.2% to represent 8.8% of total gift income or $24.41 billion in support. Bequests remain a strong source of support in good and bad economic times, changes in invested assets and real estate values. A mix of current and future gift strategies are the best prescription to overall fundraising success |
|
Click for the April, 2012 newsletter on Types of Bequests and Planned Giving Mentor article on Marketing Bequests. Bequest Statistics - indicate more than 75% of charitable bequests come from estates of decedents age 80 and older and 35% come from those who were age 90 or older at the time of death. The number of Americans age 90 or older has nearly tripled since 1980. 80% of all gift annuitants are 75 or older. (Sharpe Group, Give and Take, January, 2012) Asking for Bequests.....My colleague and friend, Steve Mourning before he died, authored a great section in a philanthropy audit for a client of Jerold Panas, Linzy and Partners. Jerry Linzy finished it for the client and it has been shared on their web site. I offer it as an additional check list to see if your program includes all the key elements of a successful bequest development program. Link here. ___________________________________________________________________________________________________ If Everyone Paid $100.....If every US taxpayer that filed a tax return, but ultimately did not pay any Federal Income Tax (FIT) would have paid $100 in for tax year 2009 (i.e., the most recent year that tax data is available), an additional $5.9 billion of FIT would have been collected by the Internal Revenue Service. Instead, 59 million taxpayers were able to pay zero through the legal use of exemptions, deductions and credits (source: IRS). ____________________________________________________________________________ Return on Investment for Planned Gift Programs.....Baruch College's Nonprofit Management Group developed a methodology for evaluating the fund raising return on investment which includes 10 categories of fund raising. Under Planned Giving/Estate Planning it states after 4 to 7 years of investment in establishing the program, the minimum return on investment (ROI) should be 500% greater than the investment. For complete report click here. ___________________________________________________________________________ Real Estate Millionaires.....There are three times more millionaires living in homes valued under $300,000 than are living in houses worth $1 million or more. Prices of smaller homes have held up better than larger ones. ____________________________________________________________________________________ New Client.....I am pleased to welcome Sissy Grantham, Executive Director, Southeastern Regional Medical Center Foundation, Lumberton, NC as a new client. Sissy and her Planned Giving Committee are committed to growing the foundation's program. The Foundation has policies and procedures in place, and will be actively contacting probable donors to explore the many beneficial options available using planned gift strategies especially gift annuities. ____________________________________________________________________________________ Laminated Gift Annuity Rate Chart for 2012.....The American Council on Gift Annuities has announced new gift annuity rates for 2012. This is the result of the decreasing return on the fixed income bond component of the ACGA investment return assumption. If you would like a laminated rate chart for the 2012 rates simply request one using the following E-mail request. ________________________________________________________________________________________________ IRS Data Shows Charitable Bequest Donors Triple Their Giving At Death..... Researchers at the U.S. Dept. of Treasury revealed the
following statistic: On average (based on IRS data from 1986 through 1997), charitable bequests during those years exceeded donors’ total lifetime charitable giving by 2.74 times. In other words, IRS data showed that the charitable bequests of estate tax paying donors/decedents on average were triple their during-life giving to charities. A few caveats on the data – the analysis looked at estates that were required to file estate tax returns and their giving histories as recorded by the IRS. This means that not included in the numbers would be smaller estates. Many planned gift folks have experienced significant bequest support from many modest donors who would not be subject to estate taxes and probably gave many times their previous total annual support. _____________________________________________________________________________________ News and Notes....By 2020 some 6.6 million Americans will be age 85 or older, up from 4.3 million in 2000. MORE AND MORE -Federal spending on Social Security, Medicare and Medicaid has risen from 16% of total government spending in 1967 to 41% of spending in 2011 (source: Office of Management and Budget). COSTS A LOT - Just 1 in 9 retirees (11%) surveyed indicated that their post-retirement expenses were less than they had expected. 22,000 retirees participated in the poll (source: Consumer Reports). SPENDING IN RETIREMENT - 45% of 625 Americans approaching retirement anticipate their greatest expense in retirement will be their monthly out-of-pocket costs for health care, i.e., insurance premiums, co-pays and deductibles (source: Nationwide). HALF AS MUCH - The S&P 500 stock index was up +5.3% per year (total return) for the 10-years ending 6/30/12. A decade ago, the S&P 500 stock index was up +11.4% per year (total return) for the 10-years ending 6/30/02. The S&P 500 is an unmanaged index of 500 widely held stocks that is generally considered representative of the US stock market (source: BTN Research). NOT A BABY ANYMORE - “Baby Boomers” are traditionally defined as the 78 million Americans born between 1946 and 1964. The oldest “boomers” will turn 66 years old in 2012 (source: BTN Research). HOUSING VALUES - The average home price in the USA dropped by 19.4% (in aggregate, not per year) over the 5-years ending 3/31/12 (source: Office of Federal Housing Enterprise Oversight). HOMES - The average sales price of an existing home
sold in the USA during April 2012 ($177,400) was +7% greater than the
average sales price of an existing home sold in April 2009 (source: National
Assoc. of Realtors). TWO OUT OF THREE - 66% of all individual tax returns filed in 2009 (92.9 million out of 140.5 million returns) reported less than $50,000 of adjusted gross income (source: Internal Revenue Service). BUSH TAX CUTS, STAY OR GO? - The cost to the US government in fiscal years 2013-2022 (i.e., the reduction in the amount of federal income tax that otherwise would be collected) if the Bush Tax Cuts are renewed only for joint tax returns under $250,000 of adjusted gross income (and single tax returns under $200,000) is projected to be $1.99 trillion. The 10-year cost (in taxes not collected) for wealthier Americans (i.e., above the $250,000 income level) is $849 billion (source: Congressional Budget Office). THE VALUE OF EDUCATION - The median net worth of American families headed by a person that received a college degree is 3.8 times as large as the median net worth of American families headed by a person that received only a high school diploma (source: Federal Reserve). ALMOST ALL OF IT - The top 20% of US households paid 94.1% of all federal income tax paid by individual taxpayers in 2009, up from 64.7% paid by this group in 1979 (source: Congressional Budget Office). FEW FOLKS EQUAL BIG BUCKS - 1% of the US population accounts for 21.8% of all health care expenditures. 5% of the population accounts for 49.5% of all health care expenditures. 15% of the population accounts for no health care expenditures (source: National Institute for Health Care Management). ___________________________________________________________________________________________________ |
||
Kudos Corner In this section I periodically highlight some recent gift expectancies and gift program elements I think will be helpful and informative, not all gifts are included. Will return in a future issue.
_________________________________________________________ |
||
James E. Connell and Associates is a national consulting service devoted to increasing resources for charities using the power of charitable estate and gift planning techniques. Pinehurst
office: PO Box 3335, Pinehurst, NC 28374 |
||
To unsubscribe
from this newsletter click this link
and in the title line put unsubscribe |
||